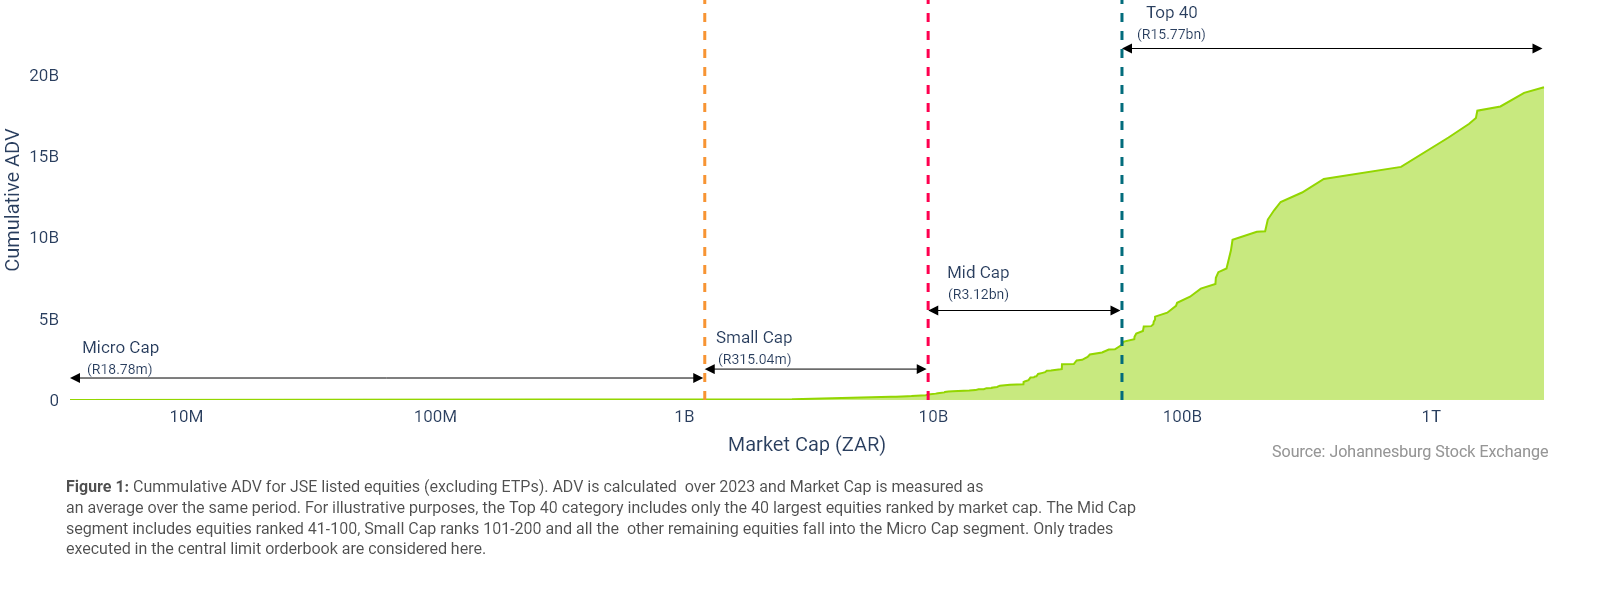
Average Daily Value (ADV) is an important measure often used by market participants to gauge the liquidity of a stock. In fact, the relationship between the two is relatively simple and easy to understand. Liquidity, by its definition is a measure of the ease with which a security can be bought or sold without affecting its market price, an indication of investor demand for a fixed supply of shares. ADV on the other hand, is a measure trading activity over a given period. Therefore, it follows that the higher the ADV is for a security, the more buyers, and sellers there are in the market for that security and the greater the ease with which it can be bought and sold.
As we can see below, a significant proportion of the daily liquidity comes from the Top 40/Large cap stocks. These stocks contributed to approximately 83% (R19.2bn) of the R23bn ADV in 2023. In contrast, collectively the micro and small cap stocks trade on average R334m (~ 2% of ADV) each day despite making up 70% of all listed equities.
Central order book volumes are shifting to larger stocks.
In general, we have seen a shift in activity over the past 8 years in two ways:
- The share of executed value in stocks with a market cap less than R50bn has declined.
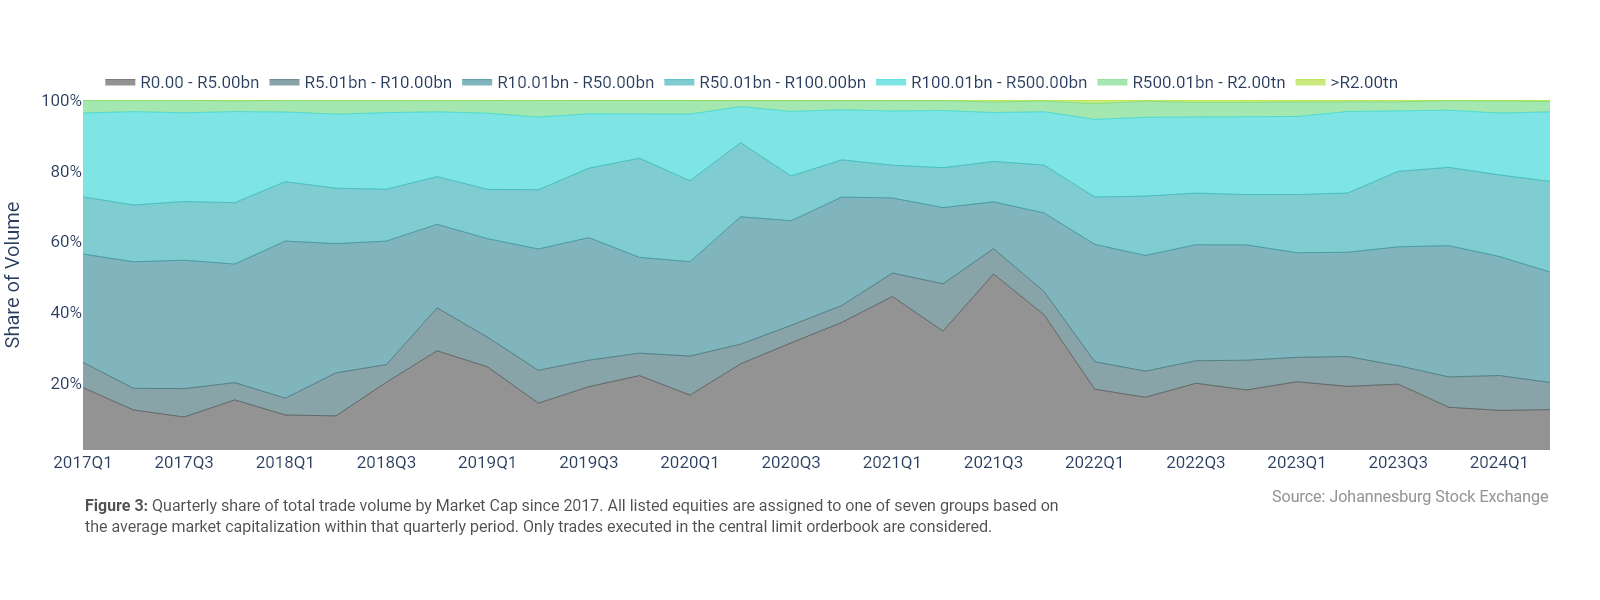
- The share of volume of stocks in the R50-R100bn band is now 1.5times what it was in 2017.
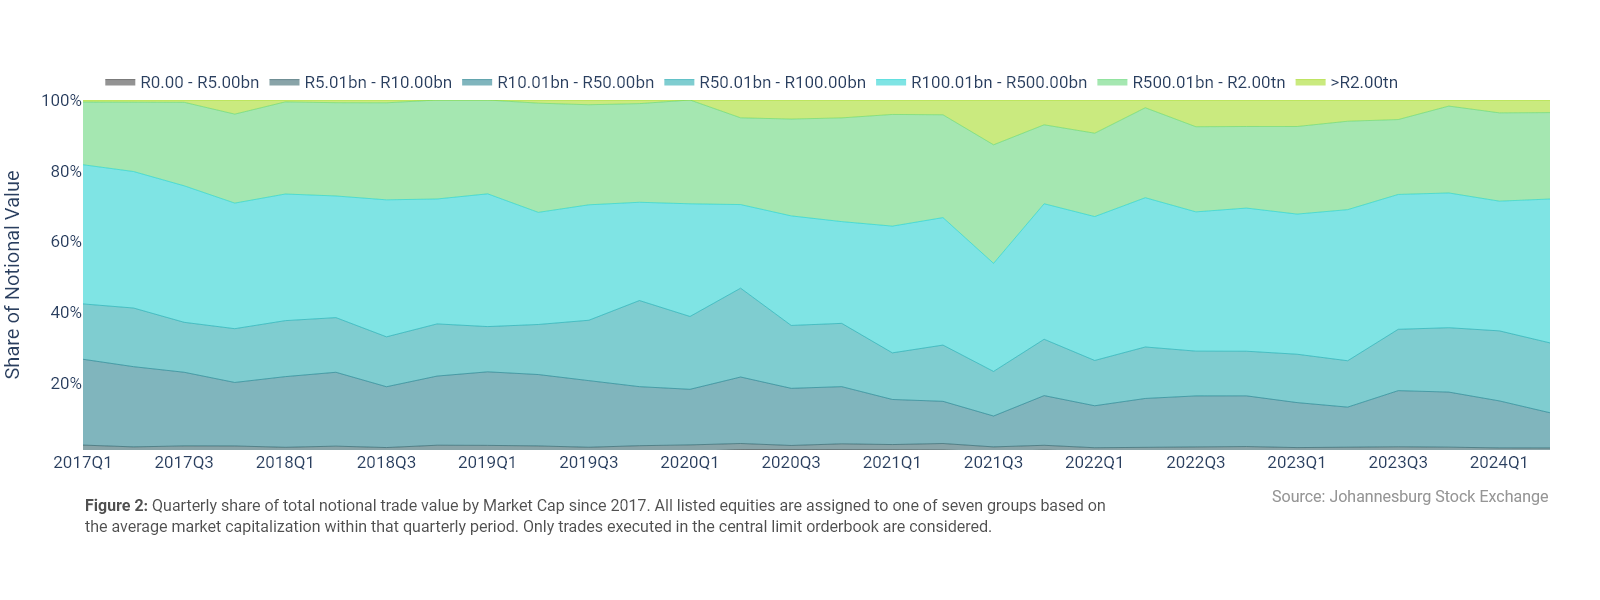
Unsurprisingly, Figure 2 shows that the concentration of activity highlighted in Figure 1 is a phenomenon that has persisted over the years. At the beginning of 2017, all companies with a size of less than R50bn accounted for 27% of the notional value executed in the central limit orderbook, today that figure stands at 15%. In contrast, the share of each of the other market cap bands has increased marginally in most instances. Looking at the share of volumes paints a strikingly different picture. Figure 3 shows us that the <R5bn band actually has a sizeable share of volumes executed at 12%. In fact, following the Covid-19 pandemic in 2020, there was a significant increase in the volumes in this band, with the share peaking at 51% in the third quarter of 2021.
Alternative measures of liquidity
The unavoidable reality is that it is very unlikely for a small cap stock to ever trade anywhere near as much as a large cap stock on a value basis. Using ADV alone as an indicator of liquidity will therefore not suffice in some cases. An additional, and relatively simple measure that could be considered, is turnover, calculated as the total notional value traded divided by the market cap. In general, the higher the turnover, the more likely it is that the stock is a liquid stock.
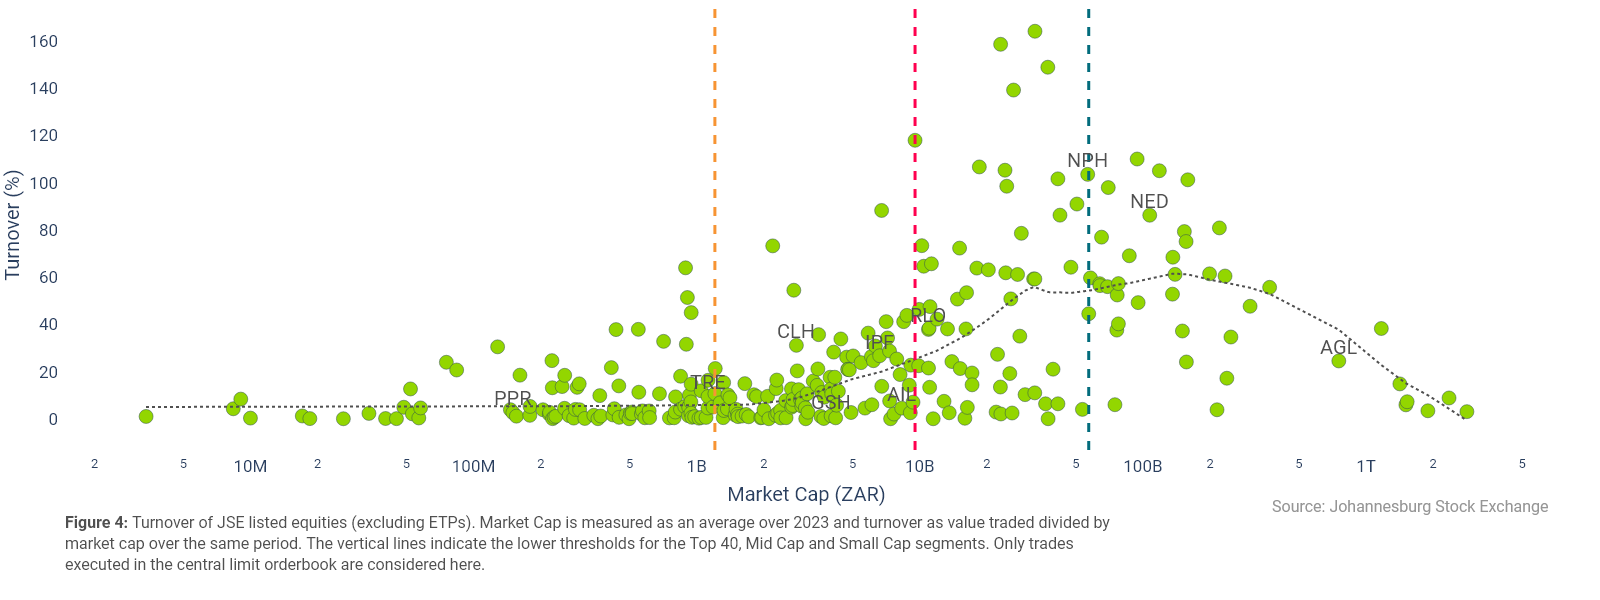
Figure 4 shows that turnover is not constant across market all segments. Generally, the lowest turnover is observed in the Micro-Cap segment and the measure increases with market cap in the Small-Cap and Mid-Cap segments. Interestingly, the trendline starts to decrease at around the R150billion market cap threshold, suggesting that some Top 40 stocks are less liquid than Mid-Cap stocks.
To close off, it is apparent that there is a concentration of liquidity at the JSE. Whether incentive schemes or an overhaul of the market structure in certain segments would improve liquidity is a question yet to be answered. It is also worth emphasizing that ADV and Turnover are rudimentary measures of liquidity. The availably of high frequency data means one can easily go beyond these measures nowadays, to look at spreads and order book depth to name a few.