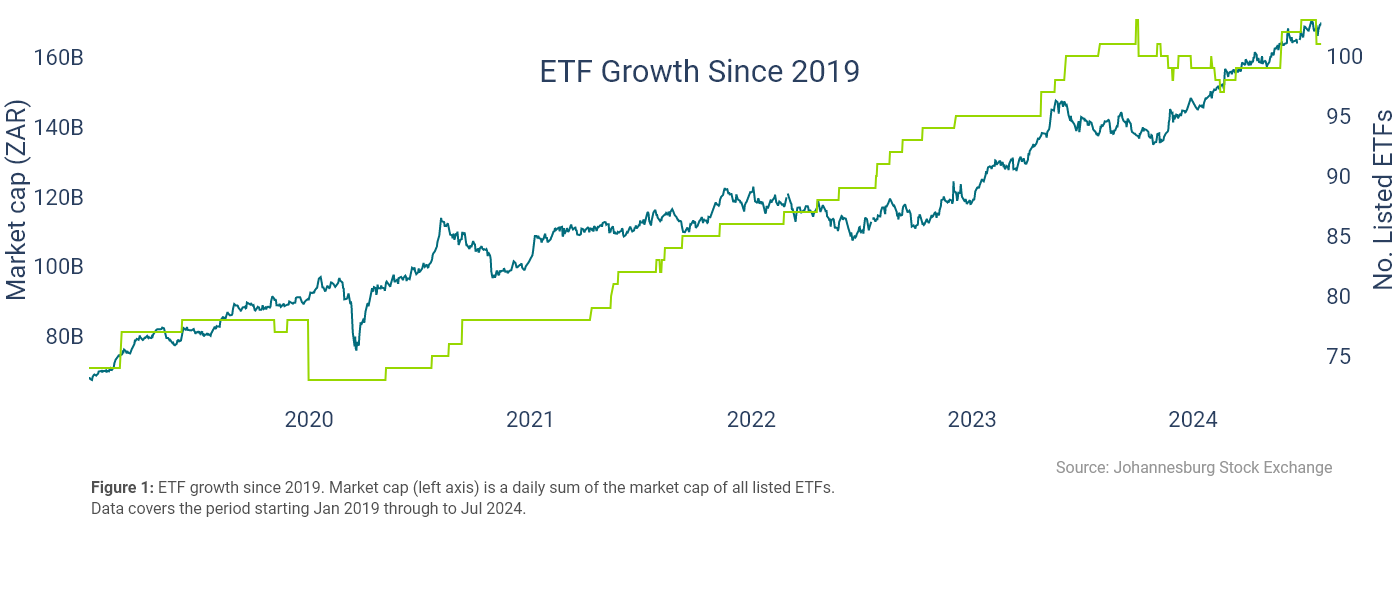
Since their introduction in the early 90’s, Exchange Traded Funds (ETFs) have enjoyed significant success as an investment vehicle, with global ETF assets under management (AuM) reaching a record $11.5 trillion at the end of 2023. Locally, the expansion of the ETF landscape has been consistent with observed global trends, albeit at a smaller scale. Between 2019 and 2024, the number of ETFs listed at the JSE increased by 35% from 74 to 103. Over the same period, the market capitalization of ETFs also increased by a staggering 147% from R68bn to R167bn.
Commodity and Global Equity ETFs rule
In 2020, ETF volumes at the JSE reached record highs, on the back of the volatility caused by the COVID-19 pandemic. Over the first quarter of the year, R40bn was traded in ETFs, consistent with trends observed in other global financial centers. Most notably, 76% of that activity over that period was in commodity ETFs alone. It is also worth noting that out of the 100+ listed ETFs, only eight are classified as commodity ETFs. On average, the global equity and commodity categories account for 75% of all ETF notional volumes traded in a year.
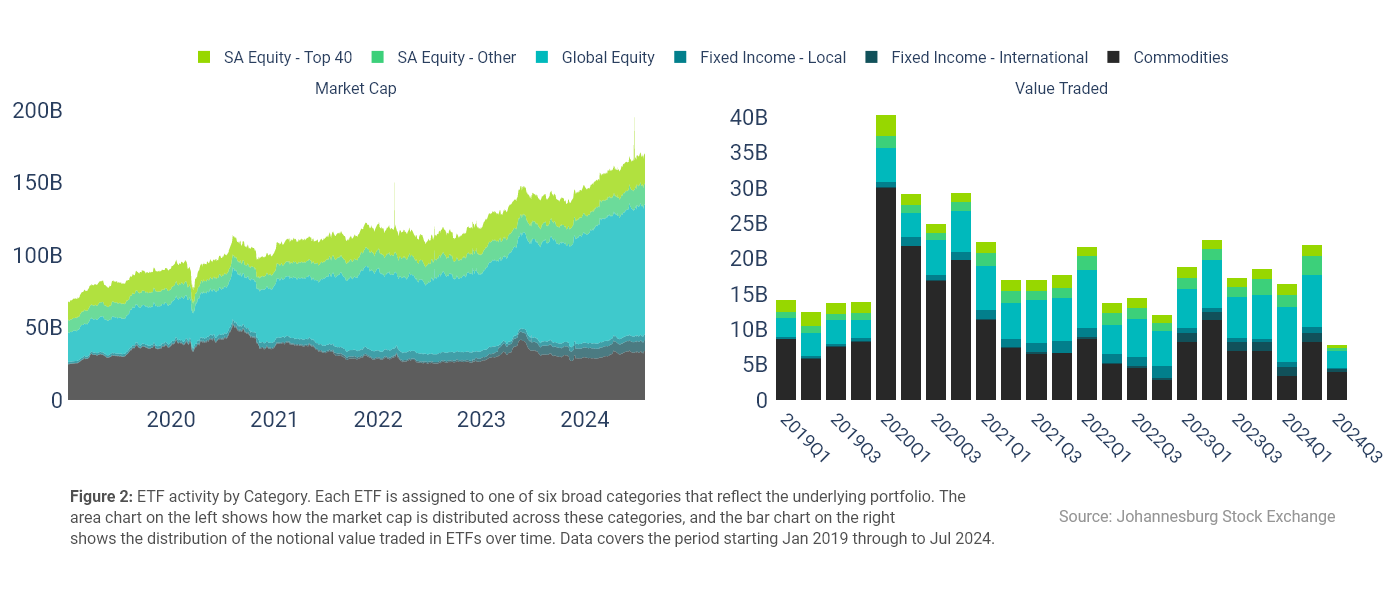
The observed growth in market cap on the other hand, has been driven by the global equity ETFs. Figure 2 shows that global equity ETFs have been the largest contributor to the market cap since 2021. This is unsurprising, considering that between Jan 2019 and Jun 2024, the number of global equity ETFs has more than doubled from 20 to 45.
ETF Market Quality
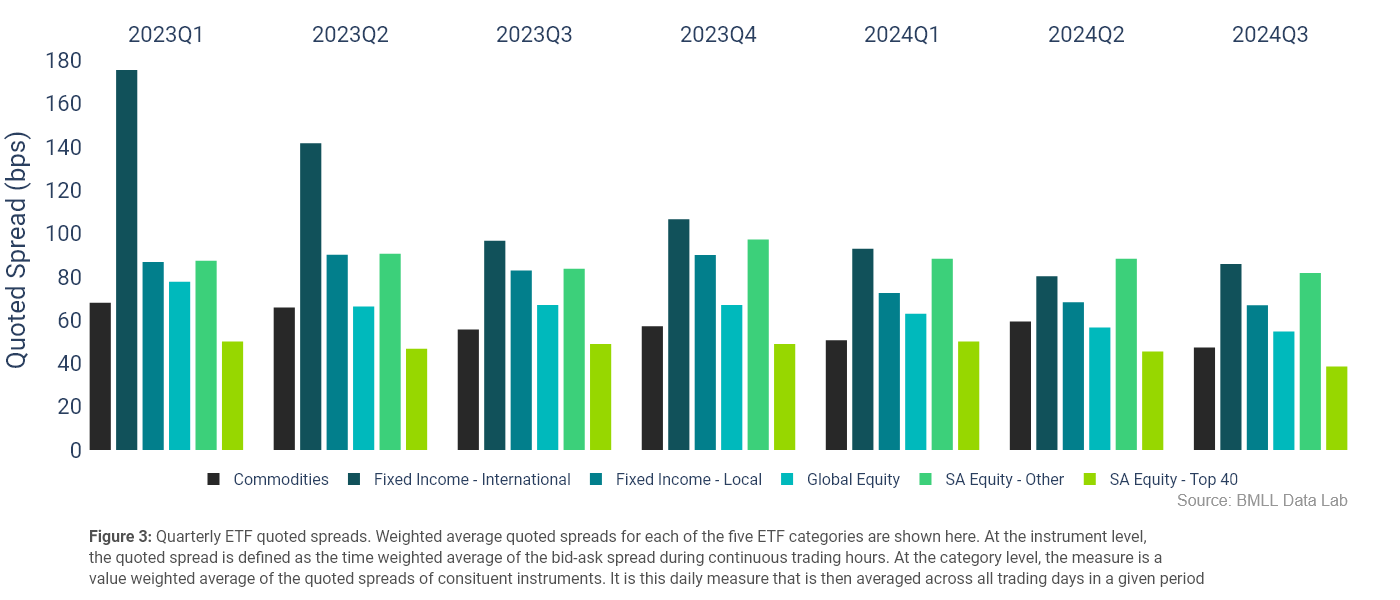
Quoted spreads are an important indicator of trading costs as they measure the cost of a round-trip trade. On this basis, quoted spreads can also be used as a proxy for liquidity (the ease with which a security can be bought and sold), as tighter spreads imply that it is cheaper and hence easier to buy and sell a given security. Figure 3 below plots the quarterly average quoted spreads for each of the ETF categories since Q1 2023. Available evidence indicates that the commodity and SA Top 40 ETFs have on average, the tightest spreads across all ETF categories. In contrast, the international fixed income ETFs generally have the widest spreads. Although, this metric has declined significantly in recent periods to be almost on par with that of the ETFs tracking non-Top 40 local equity indices.
The data also shows that global equity ETFs are generally more actively traded than the Top 40 ETFs. Interestingly though, the former category still exhibits consistently wider spreads. This observation is somewhat counterintuitive given that, as a rule of thumb, tighter bid-ask spreads mean more liquidity. As the cost of buying and selling the Top 40 ETFs is lower, it would be reasonable to expect them to trade more. Possible explanations for this may include the fact that it is appropriate for forex hedging costs to be considered when determining the price of the basket of offshore securities. Inevitably, this begs the question of how ETF units are priced.
What goes into the price of an ETF?
Fundamentally, the liquidity profile of any ETF is driven by its underlying securities. A liquid basket of securities should, in principle, result in a liquid ETF product with tight spreads. Figure 4 presents a comparison of the average spreads of the Top 40 ETFs and a basket of the individual Top 40 stocks weighted in line with the Top 40 index.
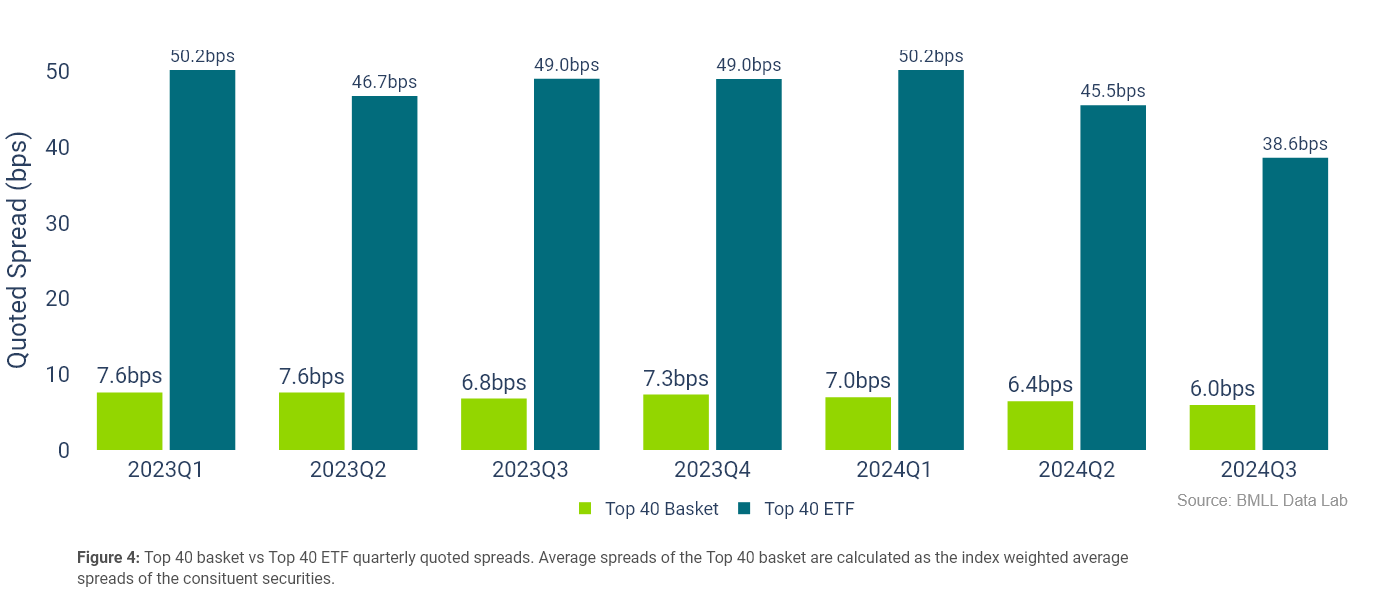
It is very clear that the spreads are vastly different, in fact, the Top 40 ETF spreads are on average seven times greater than that of the underlying weighted basket of securities. Disparities in the spreads are in fact not completely unexpected, as ETF spreads can be broken down into a series of costs. Creation and redemption fees, spreads of the underlying securities, hedging risks, taxes, and the market maker’s profit. Altogether these costs determine the prices at which ETF units will be traded. Evidently, in the case of the Top 40 ETFs, the spreads of the underlying securities make up a relatively small part of the cost of buying and selling ETF units. The magnitude of these ancillary costs may very well be a signal of inefficiencies in the creation/redemption process or significant operational risks that have been priced in.
Active vs Passive ETFs
In Q2 of 2023 the JSE introduced Actively Managed ETFs (AMETFs) to the market. Unlike traditional passive ETFs, AMETFs offer exposure to a portfolio managed through an active investment strategy with the goal of outperforming a benchmark index or sector. To date there is a total of 8 AMETFs listed across the various ETF categories. Figure 5 below compares the quarterly spreads of the AMETFs to that of the passive ETFs in their respective categories.
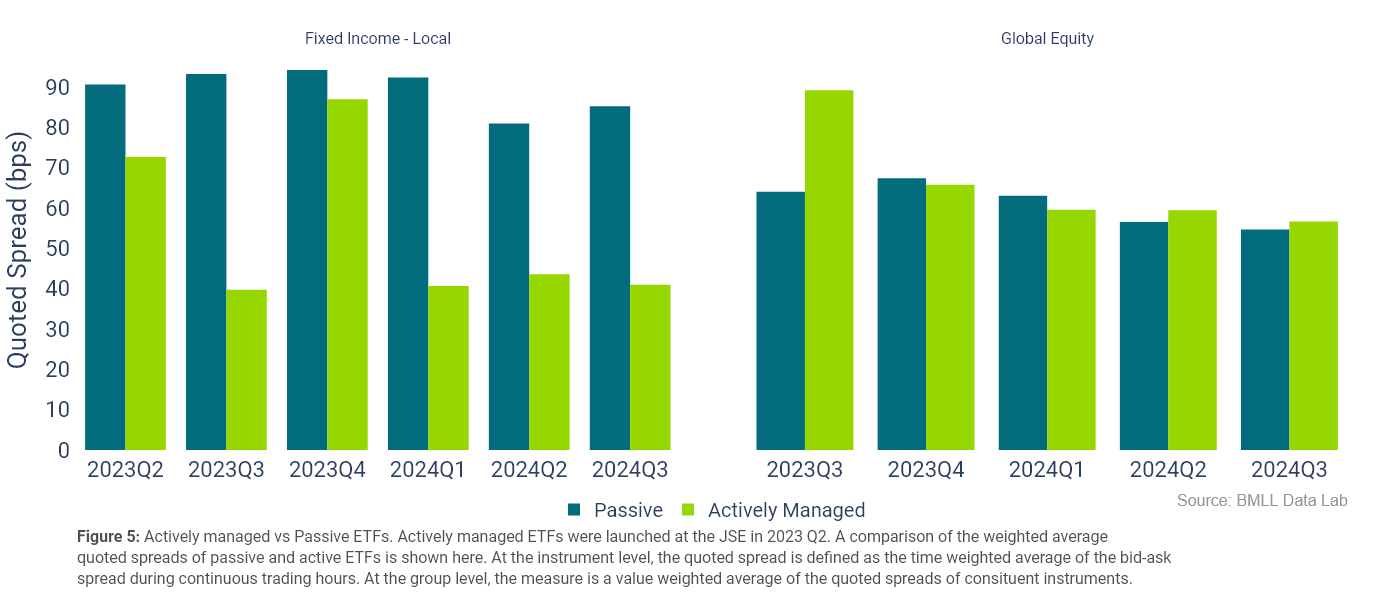
Since their introduction, the fixed income AMTFs have consistently had tighter spreads than their passive counterparts. Although, the cost of buying and selling the passive fixed income ETF units has declined over the same period. In contrast, there appears to be no significant difference in the spreads of the passive and active global equity ETFs over recent periods. This is a common observation in markets like the US where AMETF adoption is higher.
ETF outlook
According to Morningstar's latest Global ETF Flow Report, the growth of AMETFs globally has exceeded 20% globally, and at the end of 2024 Q1, 7% of global ETF assets were in AMETFs. In Q3 of 2024, AMETFs represented just over 2% of the South African ETF market, only a year after their introduction, with at least six more listings expected before the start of Q4. If the global trends are anything to go by, AMETFs present a significant growth opportunity for the South African ETF market.
Summary
- Until recently, Commodity ETFs were the most actively traded class of ETFs, however Global Equity ETFs have since taken over.
- Market makers play a vital role in the ETF ecosystem by providing liquidity and ensuring that prices paid by investors in the secondary market are fair and reflective of the value of the basket of underlying securities.
- Although ETFs aim to replicate the performance of an index, the price at which units can be bought and sold is oftentimes different from its own net asset value and that of the index due to various costs involved in the administration of the ETF.
- Active ETFs are expected to be the biggest contributor to the growth in ETF volumes.